This is a SEO version of ulpgc_cifras_2013_stc. Click here to view full version
« Previous Page Table of Contents Next Page »
DOCENCIA Y ESTUDIANTES 1
ULPGC en cifras 2013 99
3 Per f i l del estudiante de 1 er y 2º c i c lo
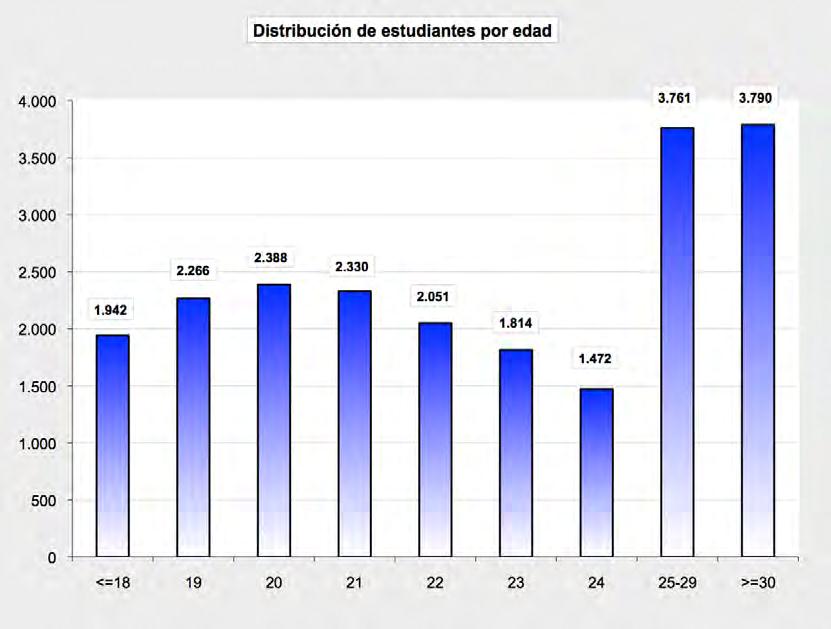
4 Es tud i antes por sexo y edad
Edad Sexo
Hombre Mujer TOTAL % <=18 845 1.097 1.942 8,90 19 954 1.312 2.266 10,39 20 1.015 1.373 2.388 10,95 21 966 1.364 2.330 10,68 22 887 1.164 2.051 9,40 23 813 1.001 1.814 8,32 24 636 836 1.472 6,75 25-29 1.595 2.166 3.761 17,24 >=30 1.637 2.153 3.790 17,37
TOTALES 9.348 12.466 21.814 100
This is a SEO version of ulpgc_cifras_2013_stc. Click here to view full version
« Previous Page Table of Contents Next Page »