This is a SEO version of ulpgc_cifras_2013_stc. Click here to view full version
« Previous Page Table of Contents Next Page »ULPGC en cifras 2013 290

7 SERVICIOS DE GESTIÓN MIXTA
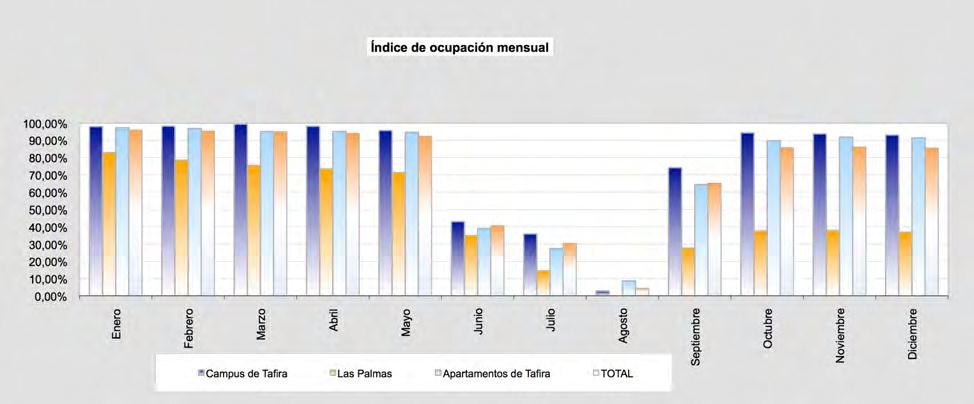
Índ i ce de ocupac i ón mensua l
Serv i c io de Alojamiento Uni ver s i tar io (SAU)
2
3
Residencia Universitaria
Mes Campus de Tafra Las Palmas Apartamentos de Tafra TOTAL
Enero 98,03% 82,81% 97,36% 95,90%
Febrero 98,26% 78,39% 96,87% 95,31%
Marzo 99,41% 75,42% 95,12% 94,99%
Abril 98,19% 73,39% 95,19% 94,09%
Mayo 95,72% 71,19% 94,60% 92,27%
Junio 43,11% 35,00% 39,00% 40,74%
Julio 35,96% 14,47% 27,42% 30,45%
Agosto 2,80% 0,00% 8,63% 4,37%
Septiembre 74,13% 27,64% 64,31% 65,06%
Octubre 94,39% 37,60% 89,74% 85,73%
Noviembre 93,78% 37,82% 91,88% 86,13%
Diciembre 93,09% 36,82% 91,35% 85,45%
This is a SEO version of ulpgc_cifras_2013_stc. Click here to view full version
« Previous Page Table of Contents Next Page »