DOCENCIA Y ESTUDIANTES
Prematrícula del curso
1
1
ULPGC
en cifras
2014
43
12
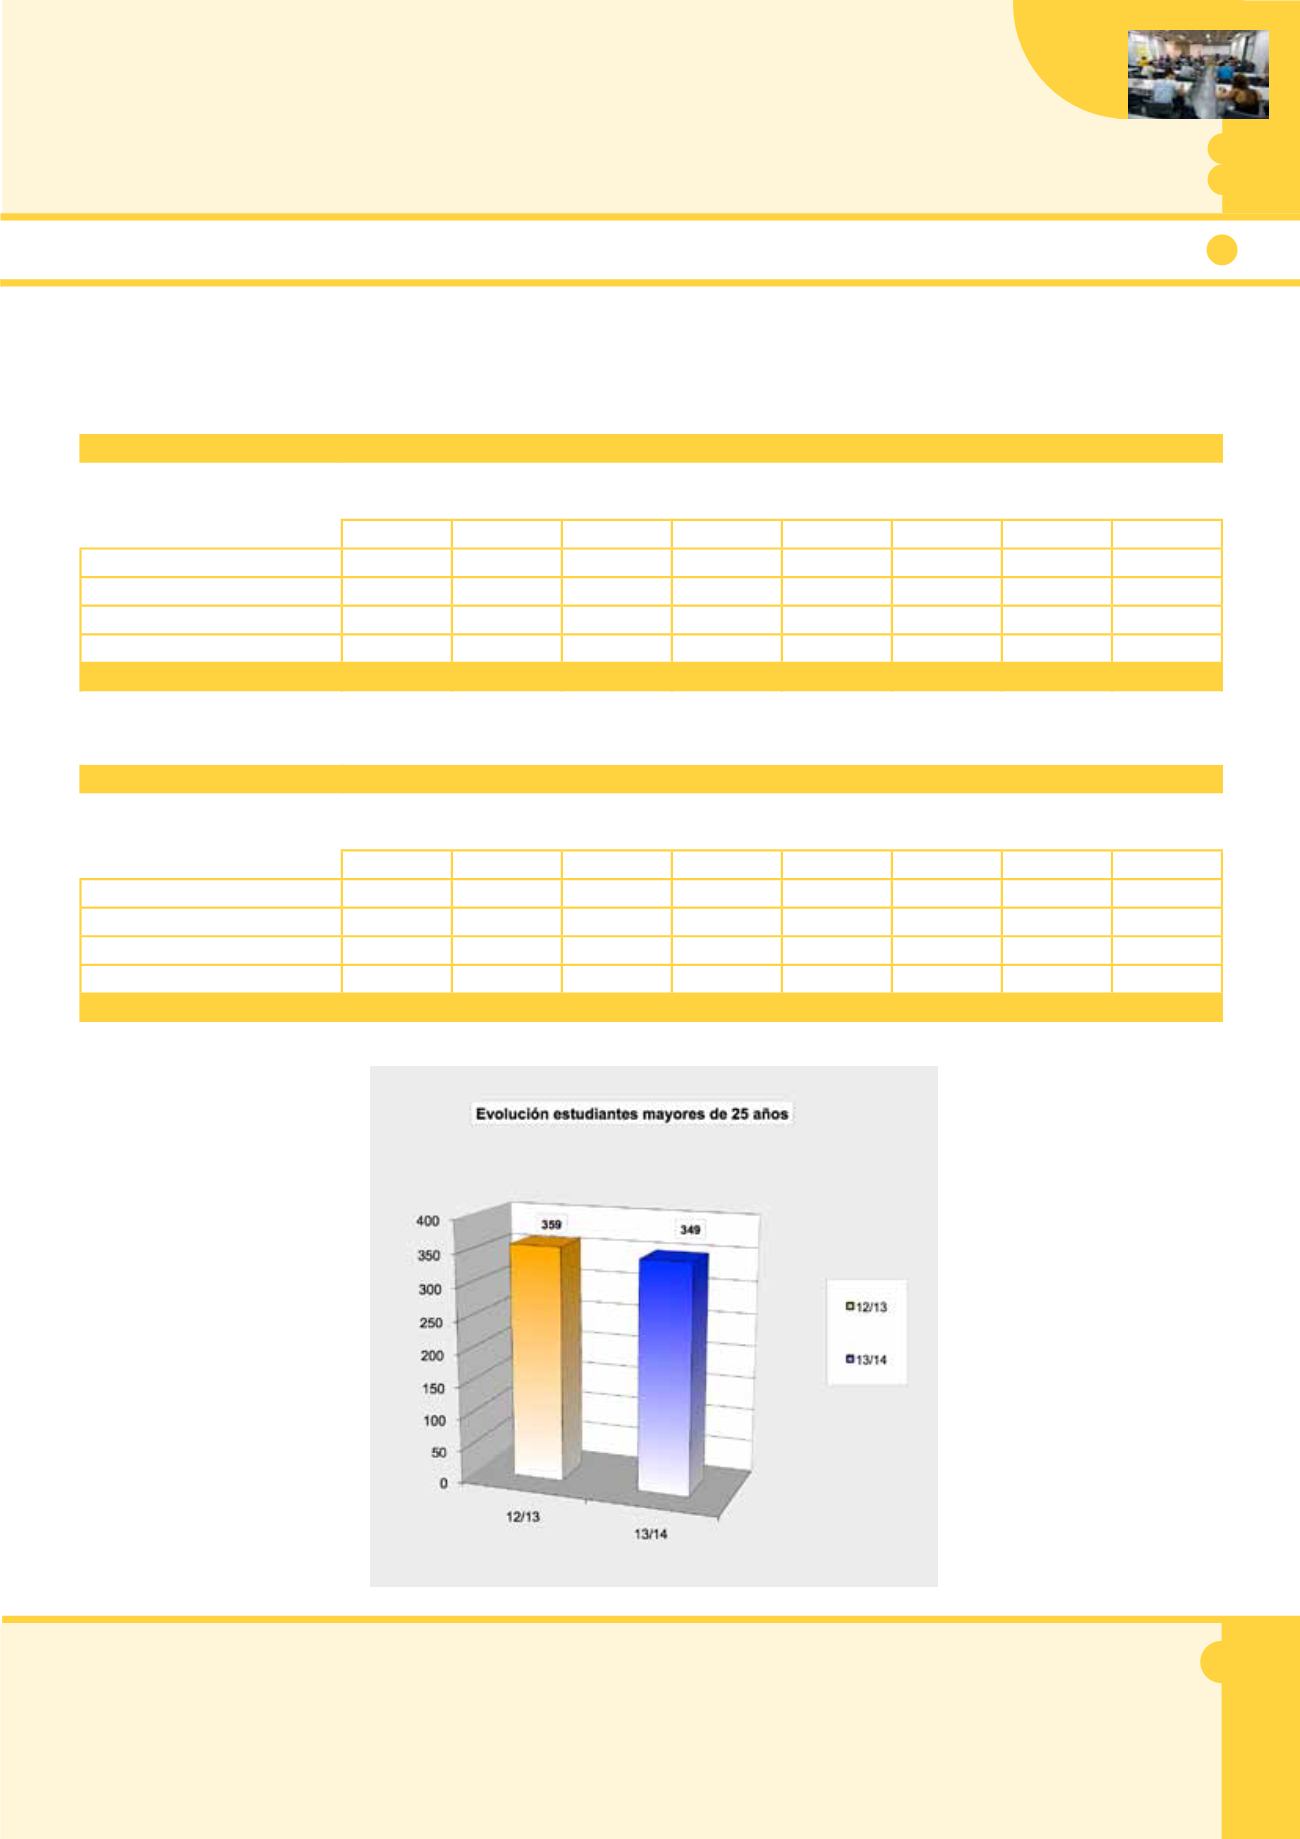
Estudiantes mayores de 25 años por áreas temáticas
Rama Temática
Nº Estudiantes 12/13
Apto
No Apto
Hombres
Mujeres
TOTAL
%
Hombres
Mujeres
TOTAL
%
Ciencias y Ciencias de la Salud
9
22
31
13,66
14
18
32
24,24
Ciencias Sociales y Jurídicas
60
77
137
60,35
34
37
71
53,79
Ingeniería y Arquitectura
11
0
11
4,85
7
0
7
5,30
Arte y Humanidades
27
21
48
21,15
15
7
22
16,67
TOTALES
107
120
227
100
70
62
132
100
Rama Temática
Nº Estudiantes 13/14
Apto
No Apto
Hombres
Mujeres
TOTAL
%
Hombres
Mujeres
TOTAL
%
Ciencias y Ciencias de la Salud
29
15
44
19,82
6
13
19
14,96
Ciencias Sociales y Jurídicas
60
61
121
54,50
42
42
84
66,14
Ingeniería y Arquitectura
10
0
10
4,50
7
0
7
5,51
Arte y Humanidades
26
21
47
21,17
9
8
17
13,39
TOTALES
125
97
222
100
64
63
127
100


