RECURSOS HUMANOS
Personal docente e investigador
3
1
ULPGC
en cifras
2014
197
2
Personal docente e investigador por edad y departamento / 2
Departamento
Edad
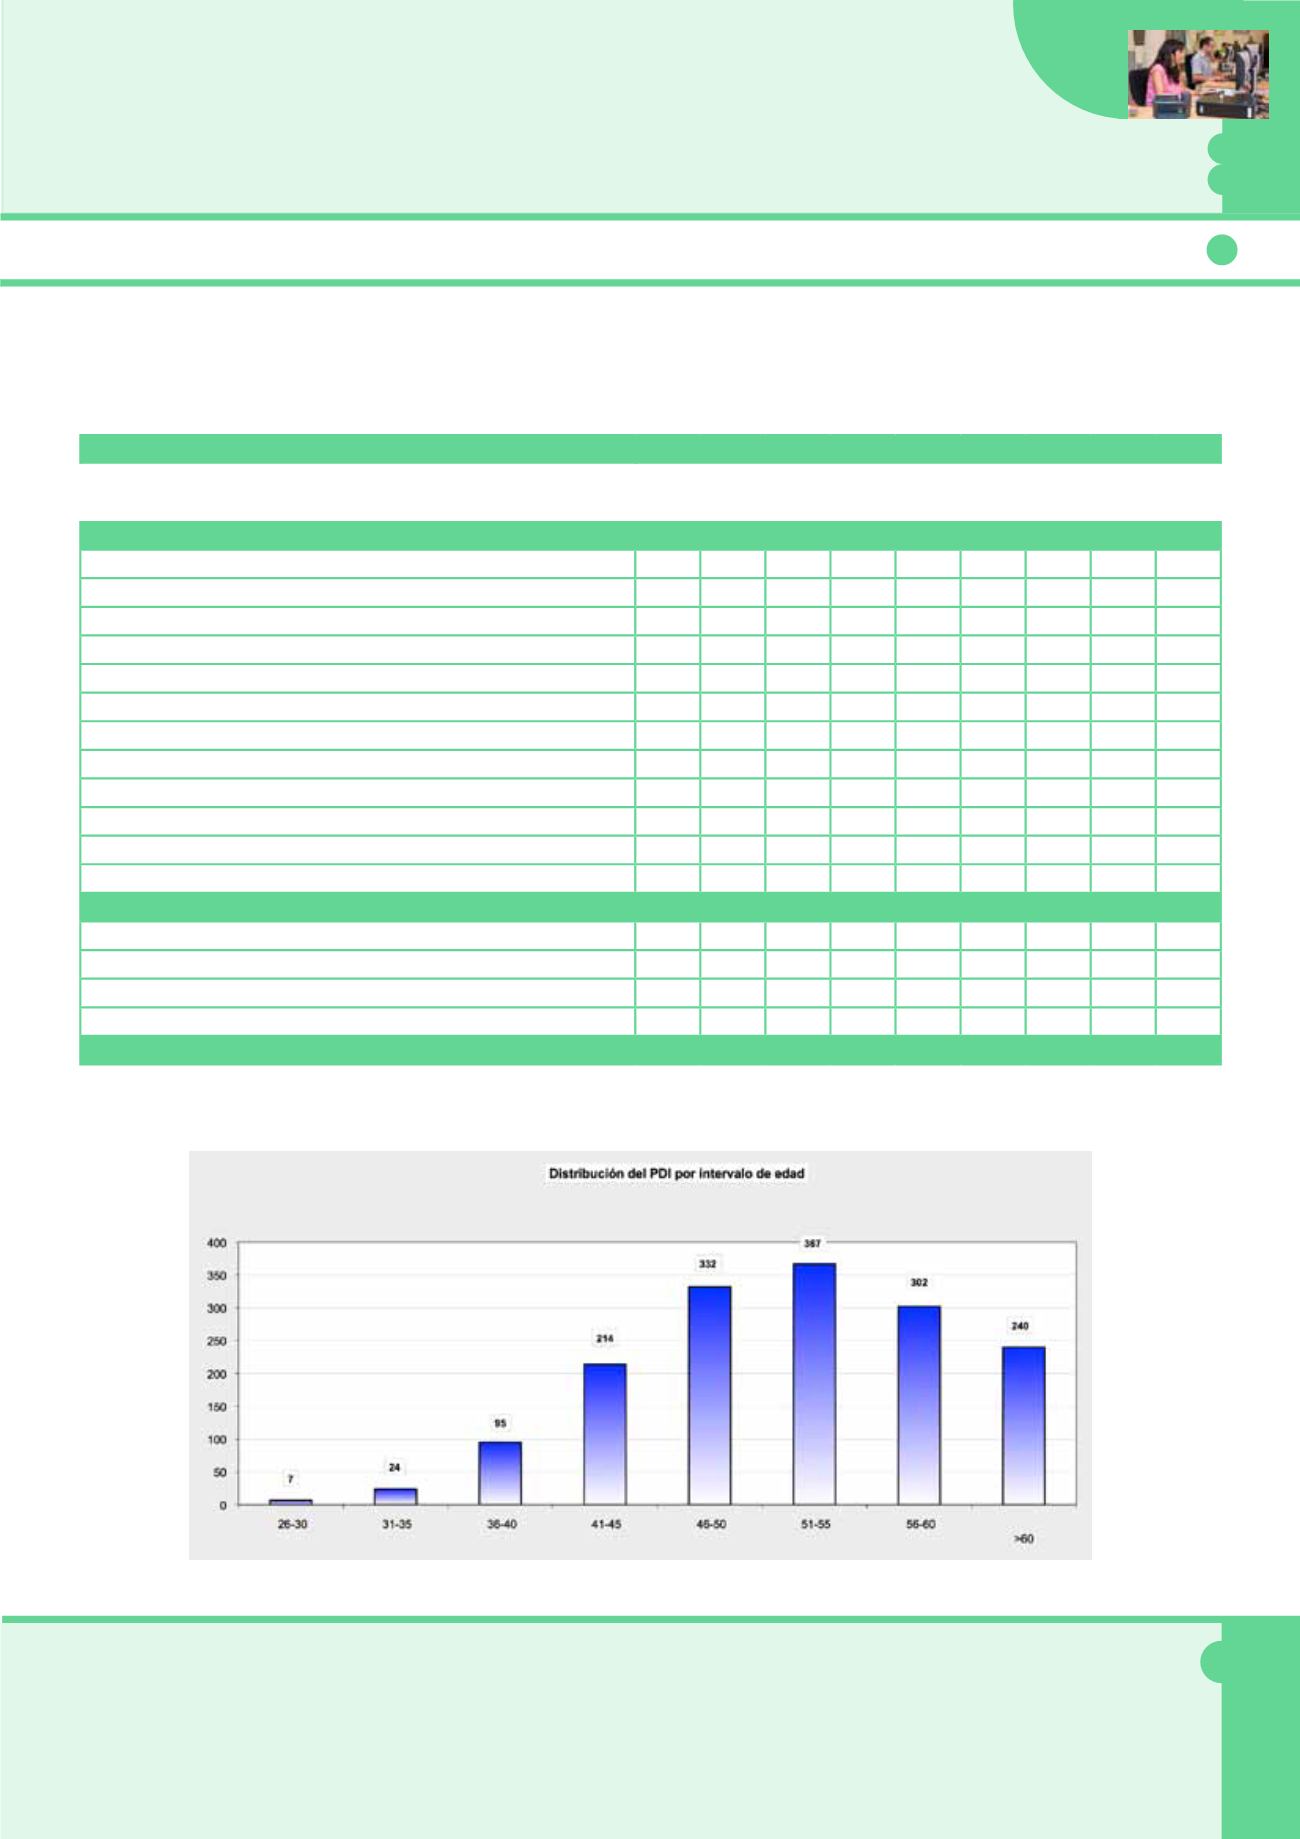
26-30 31-35 36-40 41-45 46-50 51-55 56-60 >60 TOTAL
Rama de Ingeniería y Arquitectura
3
2
12
59
84
82
70
64
376
Arte, Ciudad y Territorio
0
0
0
2
0
2
4
12
20
Cartografía y Expresión Gráfica en la Ingeniería
0
0
0
2
12
6
3
3
26
Construcción Arquitectónica
0
0
0
1
0
4
4
8
17
Expresión Gráfica y Proyectos Arquitectónicos
0
0
0
3
2
10
11
10
36
Informática y Sistemas
0
0
3
6
15
18
16
6
64
Ingeniería Civil
0
0
7
9
3
7
11
6
43
Ingeniería de Procesos
3
0
1
7
3
3
2
10
29
Ingeniería Eléctrica
0
1
0
2
1
6
4
4
18
Ingeniería Electrónica y Automática
0
0
1
9
16
11
7
3
47
Ingeniería Mecánica
0
1
0
9
2
3
5
1
21
Ingeniería Telemática
0
0
0
4
10
6
0
0
20
Señales y Comunicación
0
0
0
5
20
6
3
1
35
Rama de Arte y Humanidades
0
3
14
20
40
53
26
34
190
Ciencias Históricas
0
0
1
1
8
7
7
11
35
Filología Española, Clásica y Árabe
0
1
6
5
7
15
6
15
55
Filología Moderna
0
2
7
13
18
26
7
7
80
Geografía
0
0
0
1
7
5
6
1
20
TOTALES
7
24
95
214 332 367 302 240 1.581


