DOCENCIA Y ESTUDIANTES
1
ULPGC
en cifras
2014
101
3
Perfil del estudiante de 1
er
y 2º ciclo
4
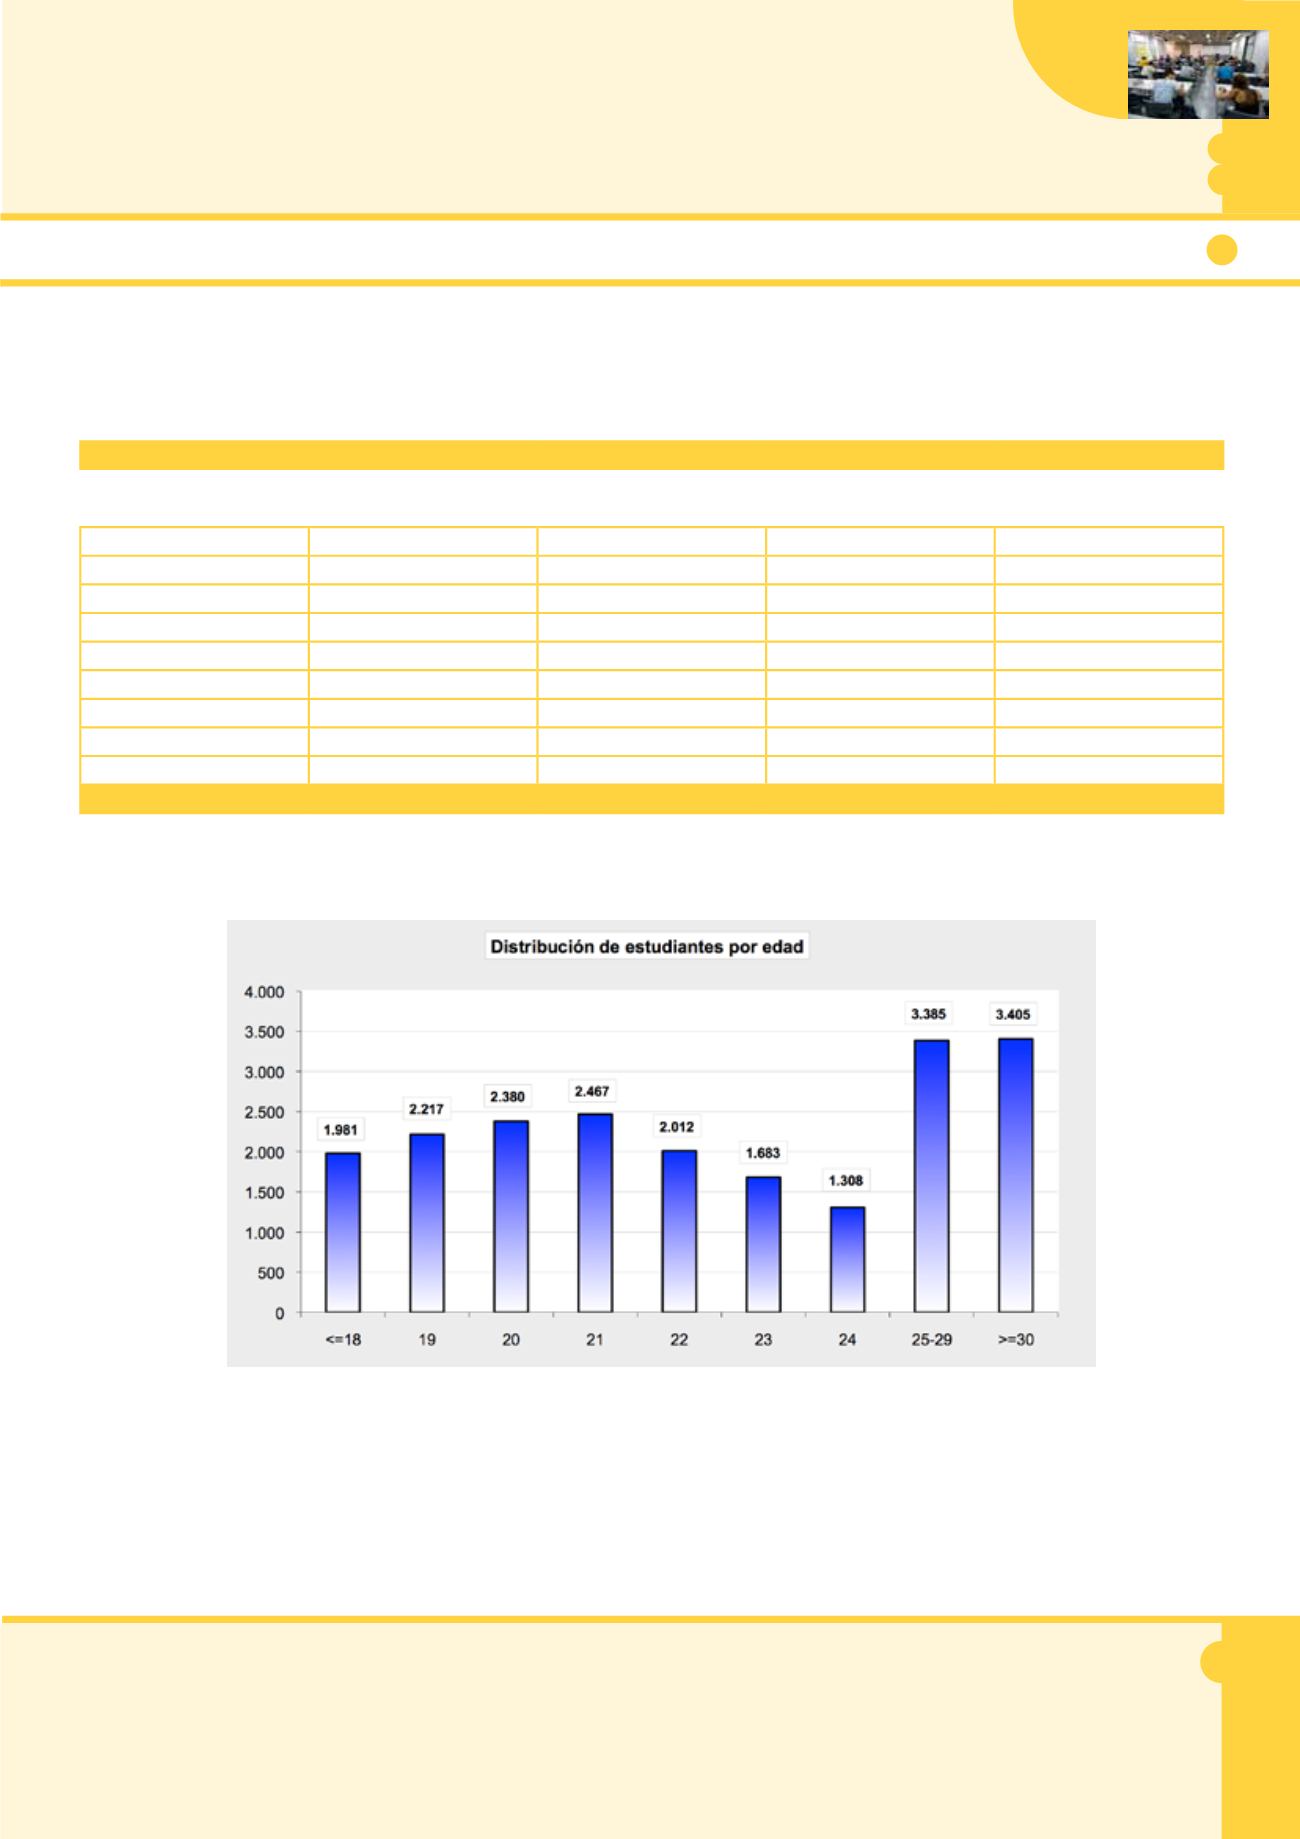
Estudiantes por sexo y edad
Edad
Sexo
Hombre
Mujer
TOTAL
%
<=18
833
1.148
1.981
9,51
19
972
1.245
2.217
10,64
20
973
1.407
2.380
11,42
21
1.022
1.445
2.467
11,84
22
888
1.124
2.012
9,66
23
766
917
1.683
8,08
24
582
726
1.308
6,28
25-29
1.421
1.964
3.385
16,24
>=30
1.409
1.996
3.405
16,34
TOTALES
8.866
11.972
20.838
100


