This is a SEO version of ulpgc_cifras_2013_stc. Click here to view full version
« Previous Page Table of Contents Next Page »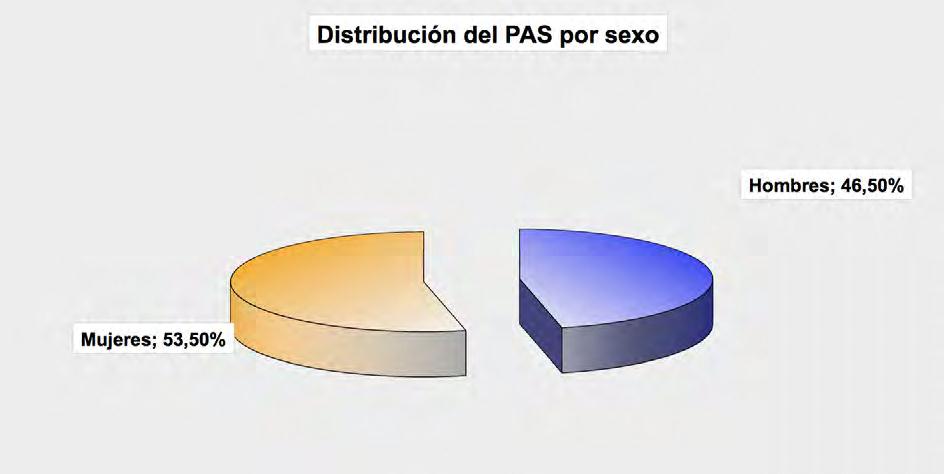
ULPGC en cifras 2013 220

3 RECURSOS HUMANOS
2 Per sonal de admini st rac ión y serv i c ios
Persona l de admi n i s t rac i ón y serv i c i os por sexo 1
Sexo Datos
Funcionarios Laborales
Técnicos de Taller
y Laboratorio TOTAL % Hombres 102 246 4 352 46,50 Mujeres 240 163 2 405 53,50
TOTALES 342 409 6 757 100
This is a SEO version of ulpgc_cifras_2013_stc. Click here to view full version
« Previous Page Table of Contents Next Page »