This is a SEO version of ulpgc_cifras_2013_stc. Click here to view full version
« Previous Page Table of Contents Next Page »ULPGC en cifras 2013 196

3 1
RECURSOS HUMANOS
Per sonal docente e invest i gador
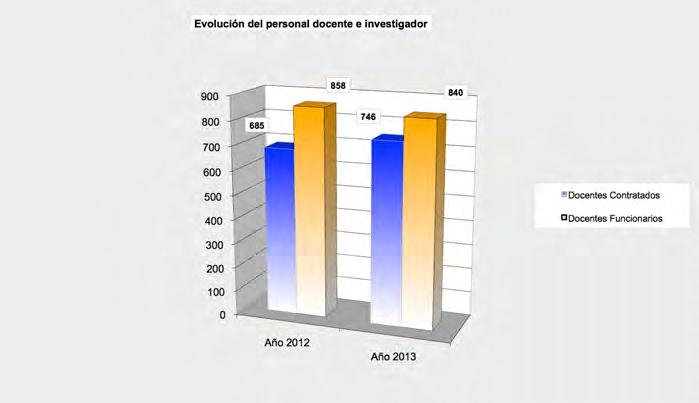
3 Evo l uc i ón de l persona l docente e i nves t i gador por t i po de persona l
Tipo Personal Categoría Año 2012 % Año 2013 %
Nº PDI % Nº PDI % Docentes Contratados 685 44,39 746 47,04
Ayudante (AYTE) 9 0,58 7 0,44 Profesor Asociado (PRAS) 1 0,06 1 0,06 Profesor Asociado CC.Salud (PACS) 1 0,06 2 0,13 Profesor Asociado CC.Salud Laboral (PACS L.) 203 13,16 206 12,99 Profesor Asociado Laboral (PRAS L.) 183 11,86 242 15,26 Profesor Ayudante Doctor (AYTED) 25 1,62 21 1,32 Profesor Colaborador (PCOL) 88 5,70 83 5,23 Profesor en Comisión de Servicio (PCS) 1 0,06 0 0,00 Profesor Contratado Doctor, Tipo 1 (PCD1) 163 10,56 159 10,03 Profesor Contratado Doctor, Tipo 1 Interino (PCD1I) 0 0,00 14 0,88 Profesor Emerito (EM) 11 0,71 11 0,69 Docentes Funcionarios 858 55,61 840 52,96
Catedrático de Escuela Universitaria (CEU) 41 2,66 39 2,46 Catedrático de Universidad (CU) 118 7,65 117 7,38 Catedrático de Universidad Vinculado (CUV) 11 0,71 11 0,69 Maestro de Taller y Laboratorio (MTL) 3 0,19 3 0,19 Titular de Escuela Universitaria (TEU) 195 12,64 179 11,29 Titular de Universidad. Interino Vinculado (TUIV) 1 0,06 1 0,06 Titular de Universidad (TU) 461 29,88 463 29,19 Titular de Universidad Vinculado (TUV) 28 1,81 27 1,70
TOTALES 1.543 100 1.586 100
This is a SEO version of ulpgc_cifras_2013_stc. Click here to view full version
« Previous Page Table of Contents Next Page »