This is a SEO version of ulpgc_cifras_2012_stc. Click here to view full version
« Previous Page Table of Contents Next Page »
DOCENCIA Y ESTUDIANTES 1
ULPGC en cifras 2012 101
3 Per f i l del estudiante de 1 er y 2º c i c lo
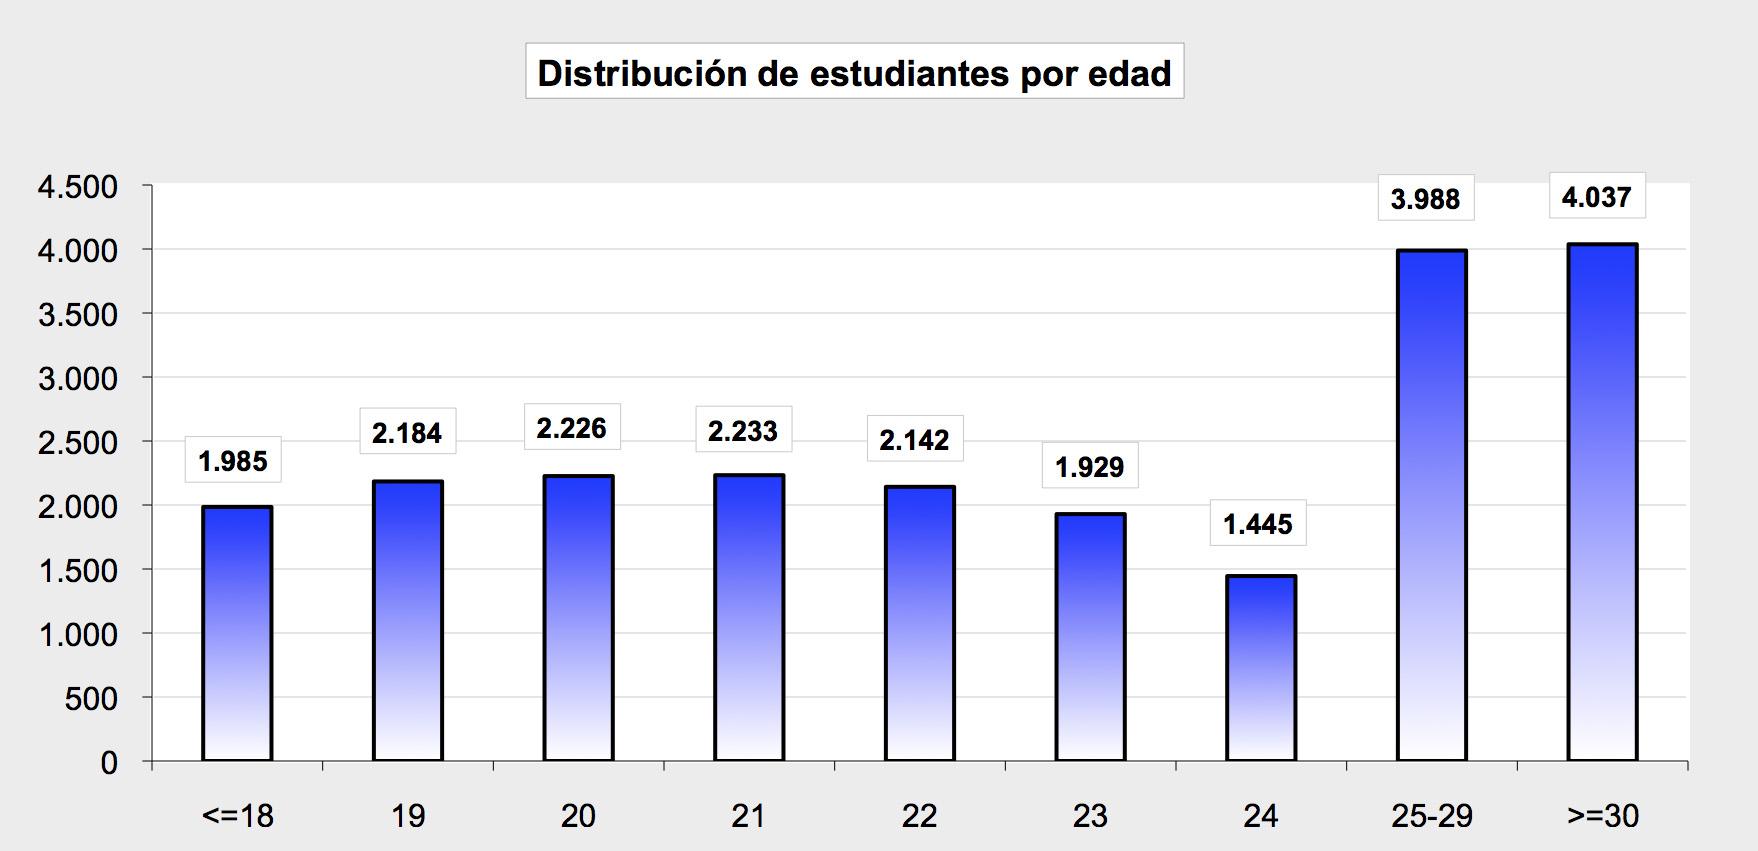
4 Es tud i antes por sexo y edad
Edad Sexo
Hombre Mujer TOTAL % <=18 824 1.161 1.985 8,95 19 982 1.202 2.184 9,85 20 898 1.328 2.226 10,04 21 904 1.329 2.233 10,07 22 961 1.181 2.142 9,66 23 822 1.107 1.929 8,70 24 623 822 1.445 6,52 25-29 1.760 2.228 3.988 17,99 >=30 1.750 2.287 4.037 18,21
TOTALES 9.524 12.645 22.169 100
This is a SEO version of ulpgc_cifras_2012_stc. Click here to view full version
« Previous Page Table of Contents Next Page »